01 January 2022
A brief history of general conference
some general statistics from 1850 to present
This document is an overview of general statistics from general conference. Some of this is based on data published at lds-general-conference.org. Their data goes back to the 1850s, while other parts of this data analysis are based on data published online by BYU, which goes from 1942 to the present.
The standard works
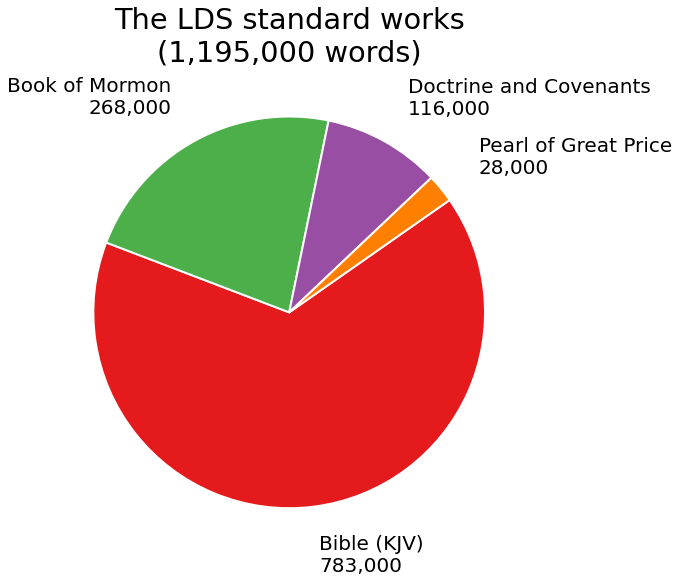
For a reference point, we begin our analysis with an overview of the LDS standard works, consisting (in English) of the King James Version of the Bible, the Book of Mormon, Doctrine and Covenants, and The Pearl of Great Price. The pie chart below illustrates their relative sizes. Roughly speaking, the Bible represents roughly 2/3 of the nearly 1.2 million words in the standard works, and the Book of Mormon nearly 1/4.
Words spoken in general conference by decade
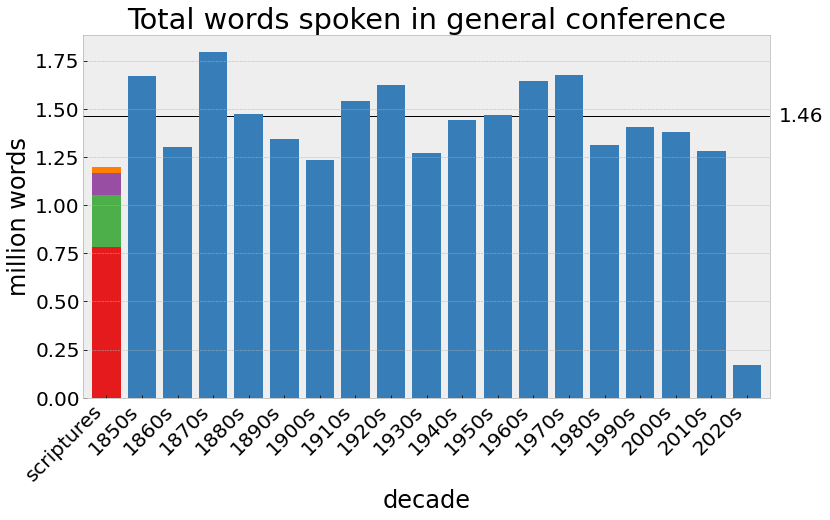
The plot below shows the total count of words spoken in general conference in each decade since the 1850s. The standard works are included for reference. There is some variation, but the word count of every single completed decade exceeds the size of the standard works, with an average of 1.46 million words per decade.
Talk length
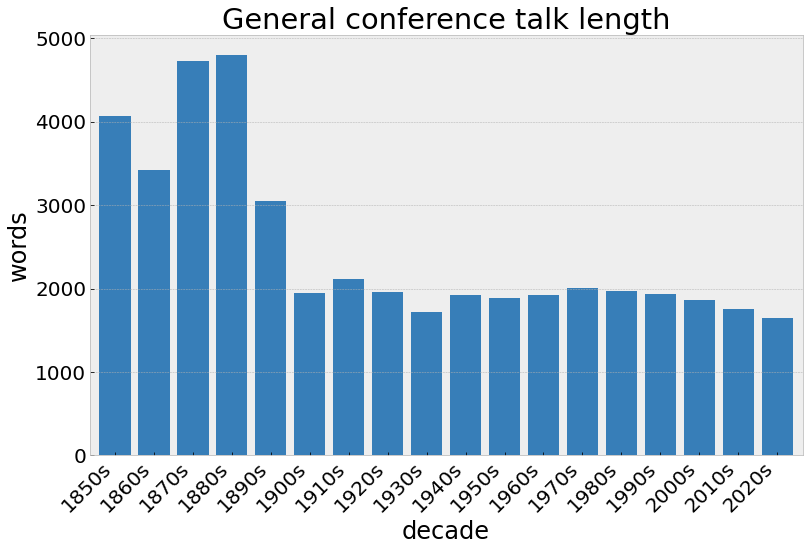
The plot below shows the average plot length per decade. While total number of words per conference has remained relatively constant, the average talk length during the 19th century was significantly longer, sometimes in the range of 4000-5000 words. Since about 1900, the average has been just under 2000 words, declining gradually since the 1970s to an average to date in the 2020s of just 1652 words.
Who has given the most talks?
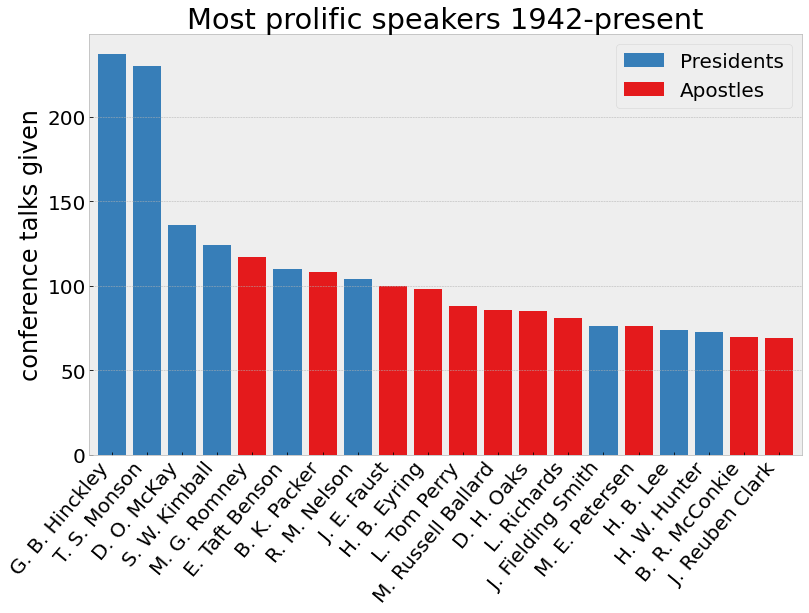
Using the full-text talk data going back to 1942, the following analysis shows which speakers have given the most talks. The plot below shows the top 20 speakers in number of talks given since 1942. A few of them, such as David O. McKay and J. Reuben Clark, were already apostles in 1942, so their actual total may be somewhat higher. However, many of the others’ totals reflect their their entire general conference speaking career. It appears that the factors leading to giving a lot of talks include becoming president of the church, serving in the First Presidency prior to becoming president of the church, and being called an apostle relatively young.
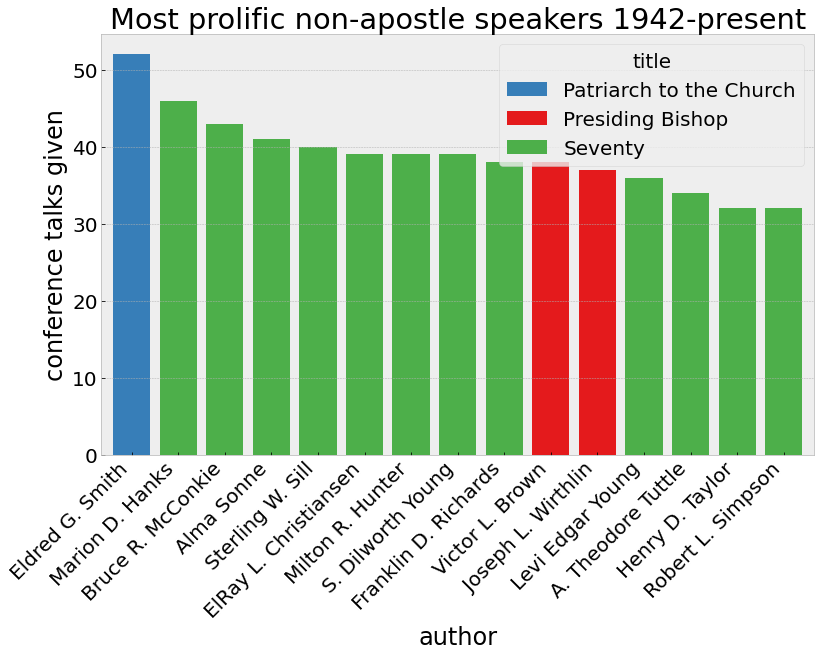
While all of the most prolific general conference speakers were apostles or presidents of the church, it is also interesting to consider which of those who were not apostles gave the most talks, which is shown in the chart below. At the top of the list is Eldred G. Smith, who held the calling of Patriarch to the Church from 1947 to 1979. In that role he spoke at least once each year in general conference.
It may be surprising to some to see Bruce R. McConkie at the top of the list. While he is often remembered as the apostle who wrote Mormon Doctrine, he in fact published that book while he was a Seventy, and he held that office for 26 years prior to being called an apostle. He was an apostle for only the last 13 years of his life, so a majority of his general conference talks were given while he was a Seventy.
The fact that so many of the Seventies on this list are from many decades ago reflects changes in leadership structure. The First Council of the Seventy, as it was called prior to 1975, was a much smaller group, and its members were given more frequent opportunities to speak in general conference.
How many different speakers are there?
Considering the number of talks given by various speakers raises a related question of how many different speakers get assigned to speak in general conference, and how frequently they get to speak. Any who has watched general conference a few times will notice that barring ill health, every apostle speaks in every general conference, and members of the First Presidency often speak more than once. There is often a number of various other speakers, most frequently Seventies, who give talks, but there are so many of them it’s hard to tell how often each one of them is assigned to speak.
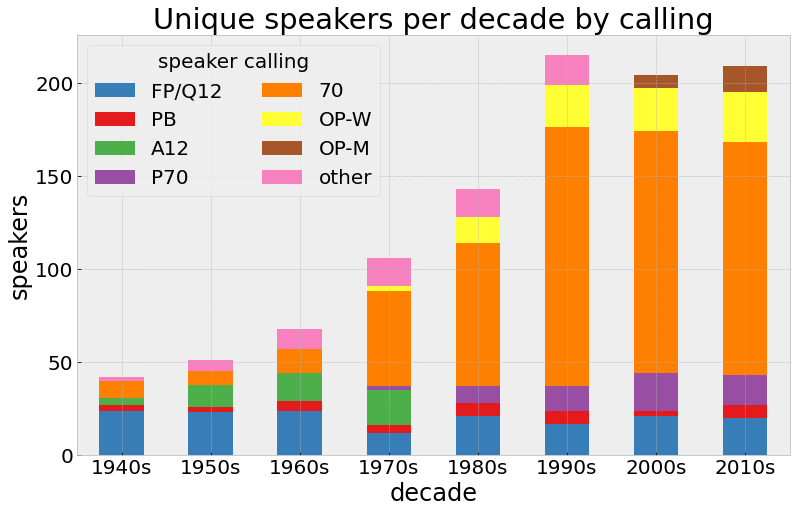
The chart below shows the number of unique speakers in each decade since the 1940s, with the bars color coded to indicate the calling categories. In this chart, “FP/Q12” represent the First Presidency and Quorum of the Twelve Apostles (in previous decades referred to as the Council of the Twelve Apostles), “A12” is Assistant to the Twelve, “P70” is the Presidency of the Seventy, “PB” is presiding bishopric, and “OP” refers to other presidencies, with “M” and “W” indicating the gender of the members of those presidencies. The “other” category includes all other non-general-authority speakers who have been assigned to speak from time to time.
The calling of “Assistant to the Twelve” was phased out in the 1970s, replaced with expanded quorums of seventy and the Presidency of the Seventy. The number of members of the Presidency of the Seventy speaking in general conference is pretty similar to the number of Assistants to the Twelve speaking in previous decade, but the restructuring of the quorums of seventy in the 1970s had a significant impact on the number of seventies speaking in general conference, which accounts for most of the growth in the number of unique speakers that occurred from the 1960s to 1990s. The other presidencies did not speak at all in general conference until the 1970s when the general Relief Society president began speaking in general conference. The other male presidencies (Young Men, Sunday School) did not speak in general conference until the 2000s.
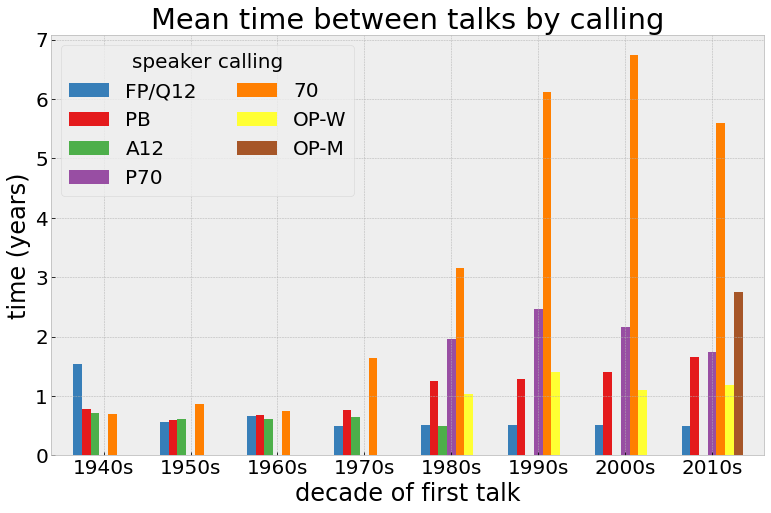
The chart below shows the mean time between talks for each speaker, aggregated by the decade in which the speaker gave their first talk. If a Seventy gave their first talk in 1975, last talk in 1995, and gave a total of 3 talks, the mean time between talks would be 10 years, and it would be included with the results for the 1970s in the chart. Speakers who only ever spoke once in general conference were omitted from this calculation.
Once again, the big shift beginning in the 1970s with the enlargement of the quorums of Seventy is apparent. In the 1950s, virtually all all of the First Presidency, apostles, Assistants to the Twelve, Presiding Bishopric, and Seventies spoke at every general conference. With more seventies called, their speaking assignments became much less frequent, now averaging over 5 years apart. Members of the Presiding Bishopric and Presidency of the Seventy still speak quite regularly, on average every 1.5 years, but the members of the female presidencies (Relief Society, Young Women, and Primary) actually now speak more frequently. Their relatively small numbers are the primary reason there are still so few female voices in general conference.
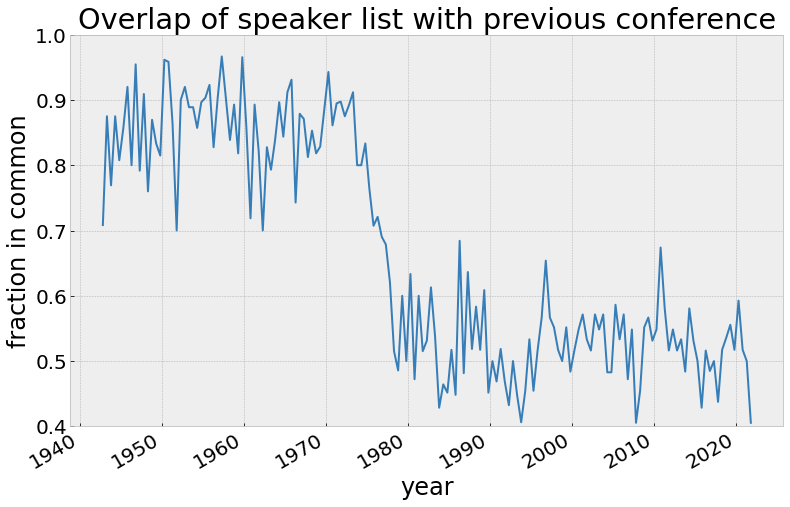
The fact that in the 1940s through 1960s nearly every general authority spoke in every general conference means the list of speakers from one conference to the next was relatively constant. This can be illustrated in the plot below showing the fraction of overlap between each general conference and the previous one. The overlap rate was generally 80-90% up until 1975, at which point things shifted quite suddenly and have held since then at an overlap rate of around 50%. The most recent general conference had the lowest overlap ever. This is possibly a consequence of changes to the format of general conference, but time will tell if that is correct.
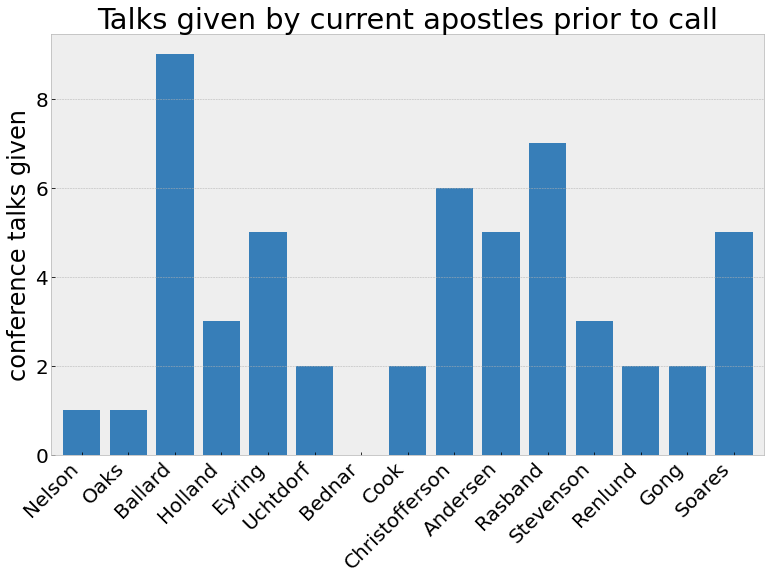
The chart below shows the number of talks given by current apostles and First Presidency members prior to their being called as apostles. David A. Bednar is the only one to have never spoken in general conference talk prior to his call. While neither Russell M. Nelson nor Dallin H. Oaks had been general authorities prior to being called apostles in 1984, both had spoken in general conference previously. Nelson spoke in 1969 while serving as a stake president, and Oaks during the 1970s while president of BYU.
Scripture citations
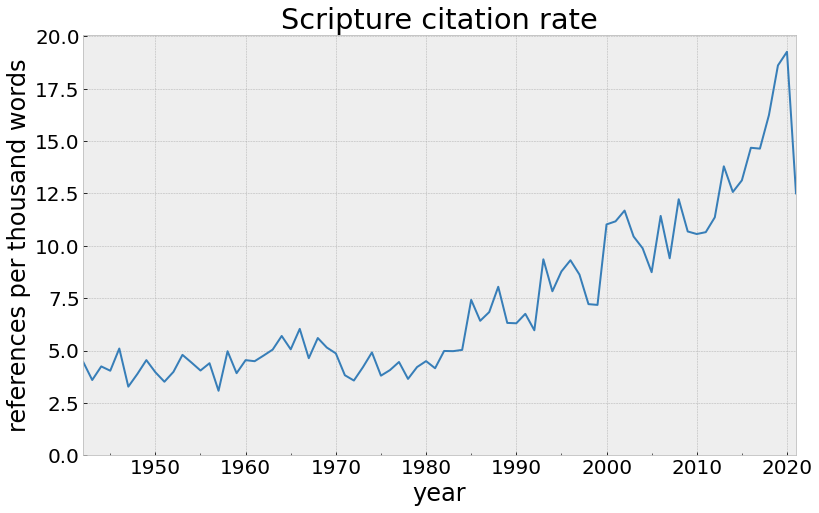
The plot below shows the frequency of scriptural citations over time. After staying at a relatively constant 5 citations per 1000 words, the citation rate started a steady upward trajectory in the 1980s, and is now over triple what it was decades ago. It is important to note that scriptural citations are not necessarily scriptural quotations. The published versions of general conference talks today are heavily footnoted and may contain multiple scriptural references in a single footnote. The trend toward more scripture citations in talks can likely be explained by the advent of personal computers, word processors and electronically indexed scriptures.
The plot below shows the same scripture citation data broken down by standard work. From this chart, it becomes apparent that nearly all of the increase in citations come from references in the New Testament, Book of Mormon, and Doctrine & Covenants. In the early decades of the data, the New Testament was the most cited standard work, while the Book of Mormon has now become the most cited, as is apparent from the next chart showing the same data as a fraction of the whole.
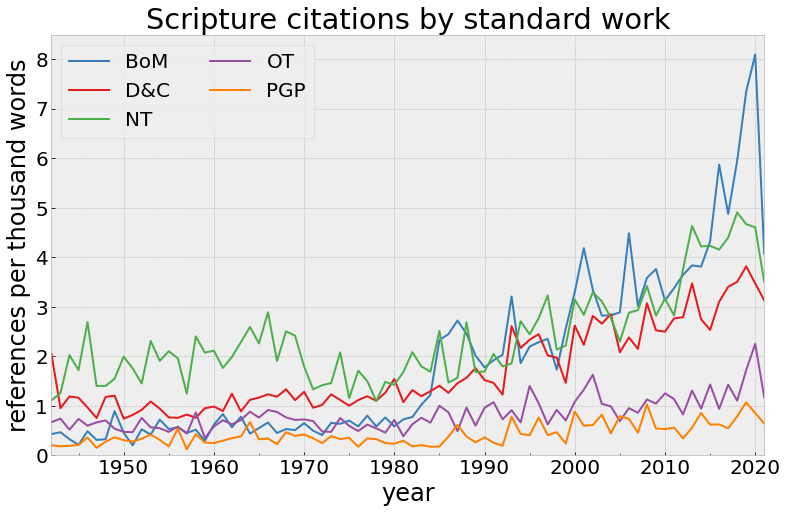
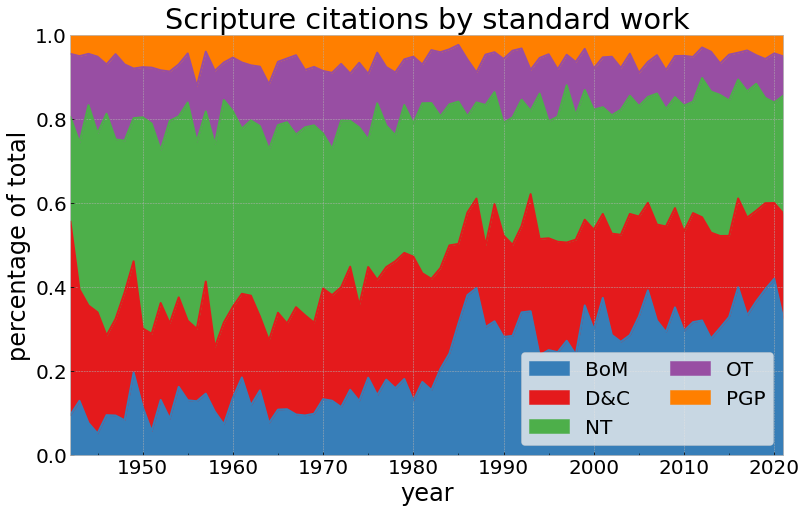
The shift in emphasis from the New Testament to the Book of Mormon can be very clearly traced to the 1980s, and is likely a response to Ezra Taft Benson’s emphasis on the Book of Mormon. A very clear shift occurs in a 3-4 period, and that shift in emphases persists today over 3 decades later.
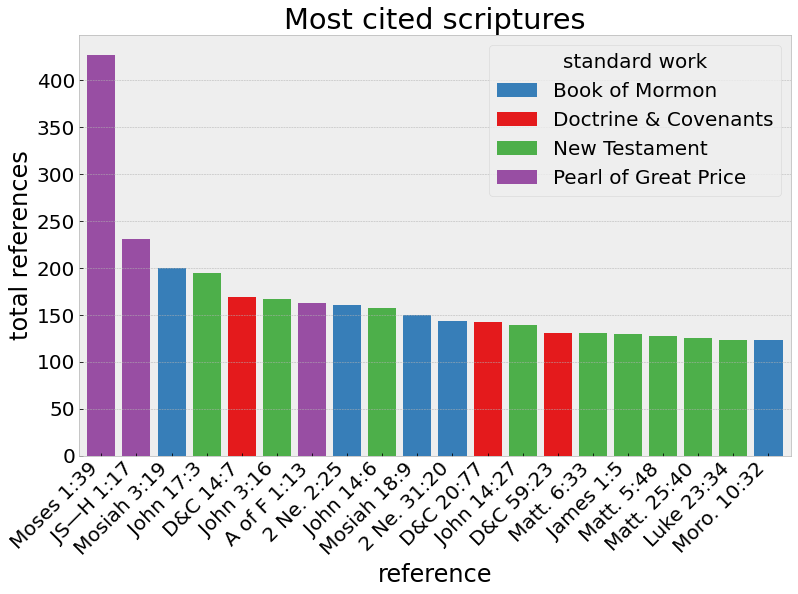
The chart below shows the 20 most cited scriptures since 1942. Moses 1:39 is the most popular by far, with nearly double the citations of the next one after it (JS–H 1:17). It is remarkable that the two most-cited individual verses are both from the Pearl of Great Price given that it has always been the least-cited standard work.